Finance
7 mins
Not every forecast needs the same level of precision. An annual budget can reasonably work from high-level assumptions. A forecast meant to answer "will we have enough cash three weeks from now?" cannot. The 13-week cash flow forecast exists specifically for that second job, and it's built differently from longer-range planning tools for exactly that reason. Good idle cash management depends on getting this specific tool right, since it's what actually reveals genuine surplus with enough confidence to deploy it.
This piece is a practical, build-it-yourself framework, not a general overview of what forecasting is.
What is a 13-week cash flow forecast, and why 13 weeks specifically?
A 13-week cash flow forecast projects expected cash inflows and outflows on a weekly basis across roughly one fiscal quarter. The 13-week window has become something of an industry standard because it strikes a useful balance, long enough to see meaningful patterns and upcoming obligations, short enough that weekly granularity stays practical to maintain and reasonably accurate.
Direct method vs indirect method: Why the 13-week model uses direct
This distinction matters more than it might seem. The direct method tracks actual cash receipts and disbursements, transactions that have happened or are specifically expected, rather than starting from net income and adjusting for non-cash items the way the indirect method does. The indirect method works fine for annual planning, investor reporting, or GAAP-compliant statements, but it's the wrong tool for week-level liquidity decisions, since it doesn't capture the actual timing of when money hits or leaves the bank. For a 13-week model specifically, direct is the only method that makes sense.
The core components of a 13-week cash flow model
The structure is consistent regardless of the business:
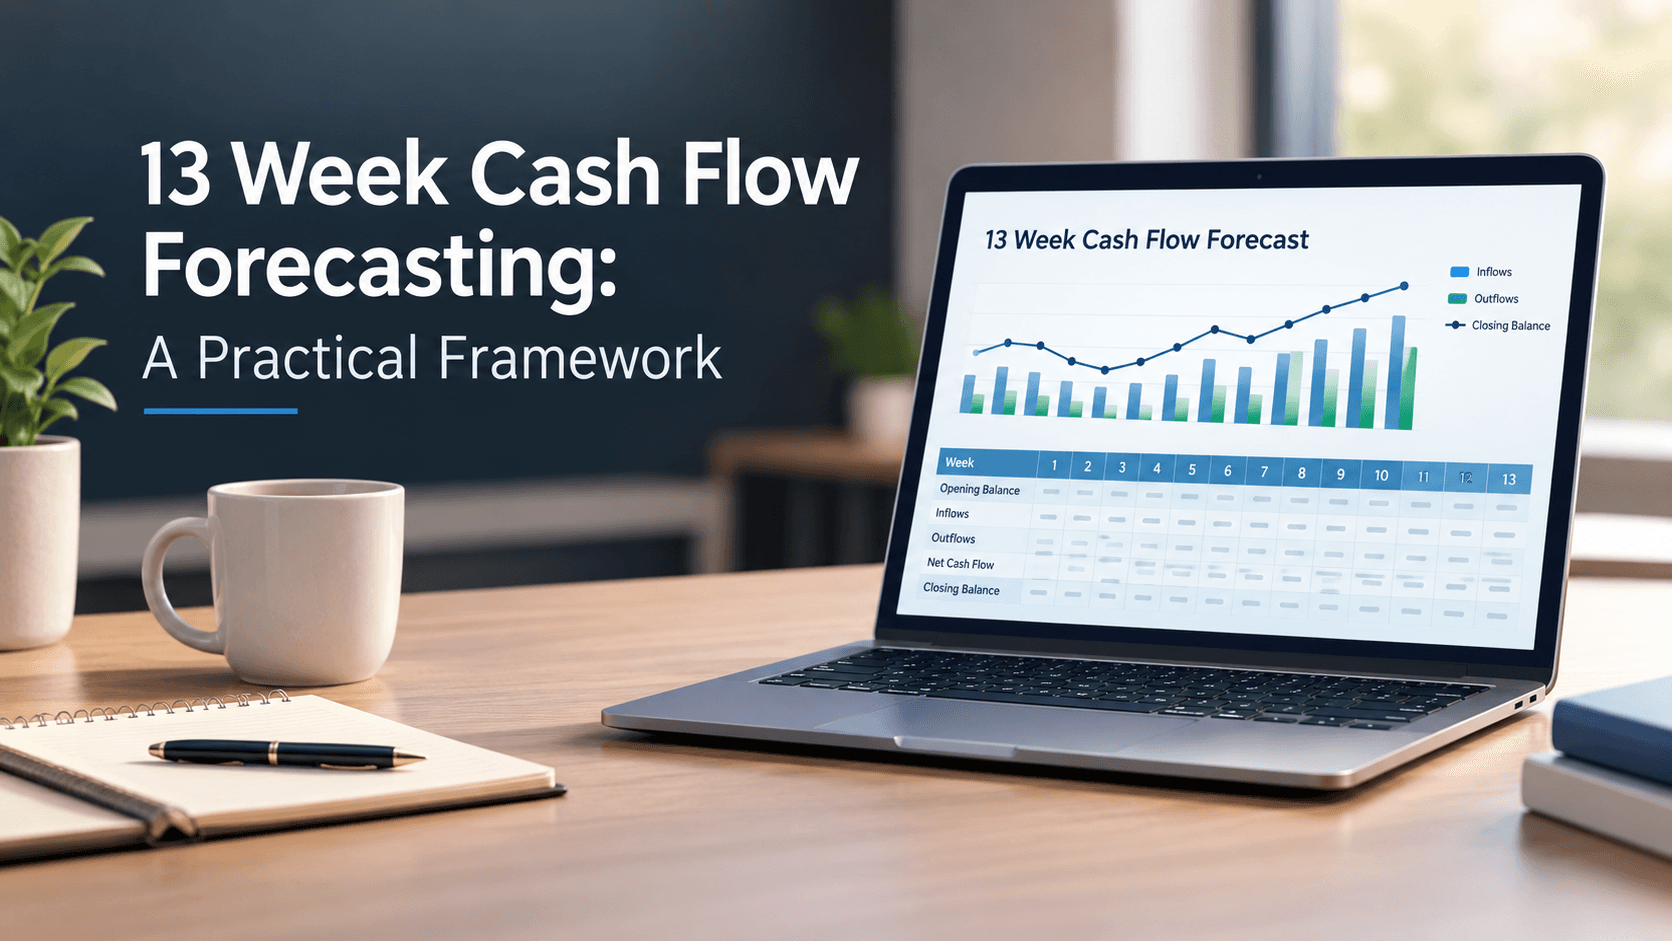
Opening cash balance, tied to the actual bank balance at the start of week one, or the prior week's closing balance for every week after.
Cash inflows, expected customer receipts and any other cash coming in, based on actual invoice due dates and realistic collection timing, not just stated payment terms.
Cash outflows, payroll, vendor payments, tax installments, debt service, and any other planned disbursements for that specific week.
Net weekly cash flow and closing balance, the difference between inflows and outflows, which becomes the following week's opening balance.
Mutual fund investments are subject to market risk. Please read scheme-related documents carefully before investing. Past performance is not indicative of future returns.
How to build a 13-week cash flow forecast: step by step
Pull your actual starting cash balance directly from your bank accounts, not an estimate.
Map out known, scheduled outflows first: payroll dates, recurring vendor payments, tax deadlines, since these are the most predictable and least likely to shift.
Build inflows from actual AR aging data, using realistic collection timing based on customer payment history rather than assuming everyone pays exactly on stated terms.
Calculate net weekly cash flow and running closing balance for each of the 13 weeks.
Flag any week where the closing balance dips uncomfortably close to your minimum buffer, since that's the entire point of building this at weekly, not monthly, granularity.
The weekly rolling discipline that makes it actually work
This is the part that separates a genuinely useful 13-week forecast from a one-time spreadsheet exercise. Every week, the completed week's forecast gets replaced with actuals, and a new week 13 gets added at the far end, so the model always looks 13 weeks ahead on a rolling basis. The 2025 AFP Treasury Benchmarking Survey, drawing on responses from over 500 practitioners, found that nearly three-quarters of treasury professionals cite cash management and forecasting as their top departmental priority, true across every level of seniority, while over 60% cite cash or liquidity forecasting specifically as the most challenging task they face. The weekly cadence isn't a nice-to-have; it's a big part of what actually closes that gap between priority and difficulty.
Common mistakes that undermine a 13-week forecast
A few patterns show up repeatedly, even at businesses that understand the methodology in theory:
Using accrual data instead of actual cash movement. Revenue recognized isn't revenue collected, and mixing the two defeats the purpose of the direct method.
Updating monthly instead of weekly. A 13-week forecast refreshed only once a month is really just a monthly forecast wearing a more sophisticated label.
Assuming customers pay exactly on stated terms. Most don't. Building in actual historical payment behavior per customer or segment produces a far more useful forecast than assuming textbook payment timing.
Why this specific horizon matters for identifying surplus
A 13-week forecast doesn't just answer "will we run out of cash?" It's also what reveals genuine surplus with enough lead time to actually do something useful with it, rather than discovering a healthy balance after the fact with no clear sense of how long it's likely to stay that way. Once a forecast reliably shows a consistent cushion beyond your minimum buffer across the full 13-week window, that's a strong signal you're looking at real surplus worth deploying, not just a temporary spike. We've covered how to tell that difference more broadly here: What is idle cash?
Once genuine surplus is identified this way, the next question is where it should actually go without giving up the flexibility a good forecast is built to protect. We've covered that structure here: How to deploy idle cash without compromising liquidity
FAQs
1. How do I create a 13-week cash flow forecast from scratch?
Start with your actual bank balance, map known scheduled outflows first, build inflows from realistic AR collection timing, then calculate net weekly cash flow and closing balance for each of the 13 weeks.
2. What's the difference between a 13-week forecast and a monthly cash flow forecast?
The 13-week model uses weekly granularity and the direct method, tracking actual cash movements, while a monthly or annual forecast typically relies on the indirect method, working backward from projected net income.
3. How do CFOs actually use a 13-week cash flow forecast day to day?
Primarily for short-term liquidity decisions, confirming covenant compliance, planning near-term financing needs, and identifying genuine surplus early enough to deploy it rather than letting it sit idle.
4. What are the main benefits of 13-week cash flow forecasting over other methods?
Weekly precision catches liquidity gaps that a monthly view would miss entirely, and research has linked weekly forecasting cycles to measurably faster collections compared to monthly-only cycles.
5. What's the most common mistake finance teams make with a 13-week forecast?
Treating it as a one-time build rather than a rolling weekly discipline. Without the weekly refresh, replacing forecasted weeks with actuals and rolling the window forward, much of the model's value disappears.
Back to all notes
Finance
5 mins
How to Evaluate an AI-Native Treasury Platform: 10-Point Checklist
“AI-native” is now a marketing label, so CFOs need a way to test it. This vendor-neutral checklist covers ten points: how the AI is built, cash visibility, multi-entity support, forecasting, policy controls, instrument range, tax awareness, risk checks, governance, and security. Use it on any platform you’re considering.
Finance
4 mins
RBI Repo Rate at 5.50%: Impact on Idle Cash, Liquid Funds & FDs
On October 7, 2026, the RBI raised the repo rate by 25 basis points to 5.50% and changed its stance from neutral to calibrated tightening, its first hike since February 2023. This piece covers what changed, how it affects liquid fund returns and FD rates, and where companies should park idle cash while rates rise.
Finance
5 mins
Cash Pooling: How Companies Consolidate Idle Cash
Cash pooling combines the balances of several group entities so surplus in one can cover shortfalls in another. In India, notional pooling isn’t available, and physical pooling is treated as intercompany lending with company law and tax consequences. This piece explains how pooling works, what Indian groups can do, and where the pooled surplus can go.